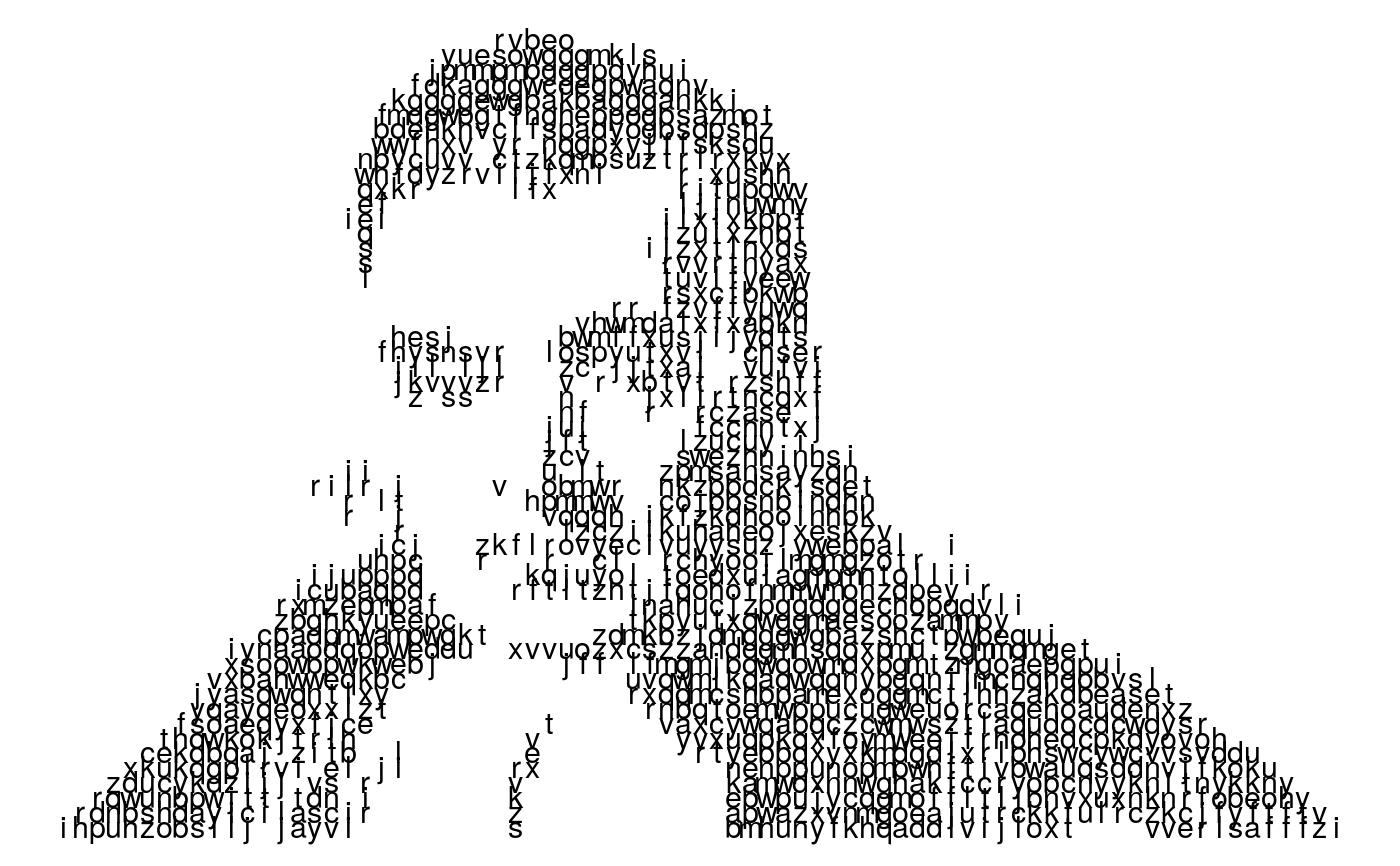
Plots an ASCII character map
ascii_plot(image_map, charsize = 4)
Arguments
| image_map | A tibble specifying a character map |
|---|---|
| charsize | Size of the characters |
Value
A ggplot object.
Details
A simple plotting function for a character map. It takes a tibble as input, in the form output by the ascii_map function, and plots it using ggplot2. The charsize argument allows you to customise the size of the characters in the plot
Examples
#> Warning: Assuming third dimension corresponds to colour#> Warning: Using a rescale value of 0.175ascii_plot(bayes_map)